Page Index
- Technical Volume
- Financial and Management Volume
- References
Technical Volume
This volume is about the technical aspects on this project, presenting information about the system-as-designed and system-as-built.
Executive Summary
Addresses: What is this project about and Why?
Final release of a solution that performs real-time analytics on the health of microcontroller systems in ambulance(s).
At the start of the winter semester, our team decided to split into two-subteams. One dealing with the pump device, and the other dealing with failure reporting and visualizing system health. I (Siddharth Bhardwaj) took ownership of the latter. (More information about the earlier phase of our project can be found here.) In this part of the project, under the supervision of Professor.Franz Newland, I’m building a robust mechanism to collect health data of the automated BVM system. The end-goal of this solution is to share this data real-time with the ambulance crew and base station personnel that monitor the health of the system.
In this solution, I create a mesh network of XBee transceivers to continuously send and recieve a Raspberry Pi’s health data. Data on the mesh network is transmitted through peer-to-peer communication, and the microcontroller’s health data is dependent on a real-time ouput from a gyroscopic sensor. (The gyroscope sensor simulates a automated Bag-Value-Mask (BVM) pumping mechanism in operation, inside of the ambulance). As system health data from the Pi is continuously transmitted, it is processed on a Basestation PC before being stored real-time onto a structured database, on the Cloud. As system health data is stored realtime, it presented realtime- as visuals on web-based analytics dashboard. A “open-source and free first” approach is used where Python3 and free Google services such as Google Spreadsheets and Google APIs (under a trial account) are used to implement a mechanism for data processing, data storage onto the Cloud, and data visualization on a stand-alone website.
Product Vision
Addresses: What is it doing?
This product is:
- Providing a mechanism to report issues.
- Providing a low cost, mesh based communication- allowing others abumblances to support a crew that might have fault.
- Providing a way to visualize data as gathered, real-time.
- Providing a way to push notifications to users if an issue is detected.
- Providing a way to configure the application during run-time, without stopping it.
- Providing a way to read health data from any type of pumping mechanism, using a gyroscopic sensor.
At the moment there is no automated reporting of device failures in an Ambulance operating in Gujarat, India. Thus, there is a need for automated failure reporting for mobile medical devices, used in various medical fields.
In essence, through this solution, the ambulance crew does not need to manually report/call-in a failure to the basestation personnel. Furthermore, it allows one ambulance crew to support another, incase one experiences fault. The value is: if a automated BVM unit fails then a higher load is placed on the crew, on top of pressure of caring for patients. This solution minimizes the high workload placed on the ambulance crew, allowing them to focus on their patients while providing a robust mechanism for reporting system failure. Furthermore, system health data that is collected realtime, is visualized realtime i.e. is leveraged to allow base station personnel to formulate a meaningful strategy to handle system failure (for example, re-route other active ambulances on the mesh network for support, incase one ambulance is experiencing fault with it’s BVM).
With more features added post-alpha and post-beta releases, this solution now supports: sending push notifications to base station personnel through email or cell, reading data from a gyroscope sensor that can be connected any type of pumping device the ambulance crew may be working with, and has significantly enhanced product configurability and ease-of-use through reading parameterized (often hard-coded) data from a modulated and stand-alone, config file. Also, reliability of visual generation was also enhanced based on testing in Data Propogation Reliability Test section. Please refer to Technical Video Demonstration section to see demonstrations of product evolution and functionality.
Solution Architecture
This section presents the system-as-desgined and system-as-built through a series of diagrams, which were used to architect this project’s solution. The presented diagrams range from high-level to low(er)-level.
Architecture Diagram
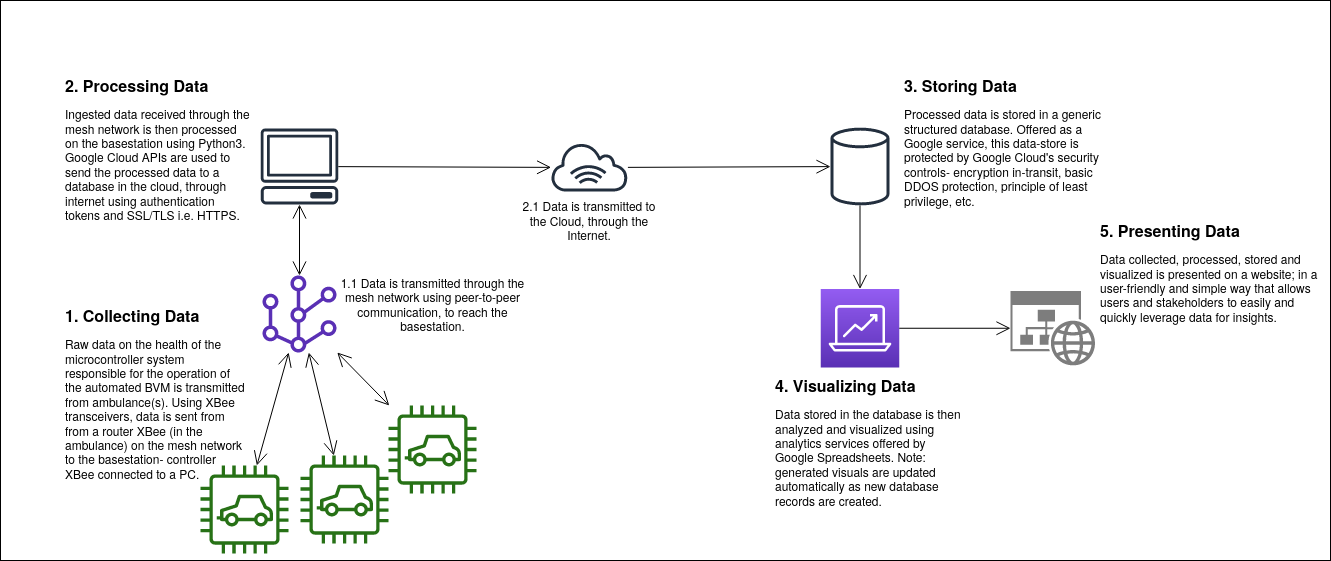
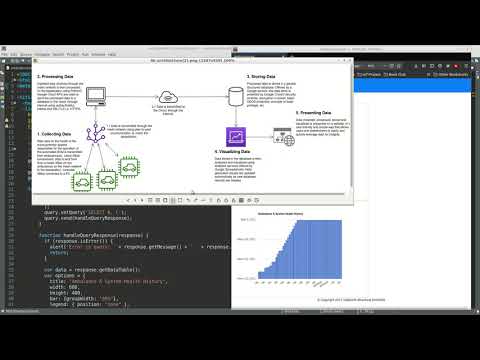
Figure1 shows the end-to-end architecture of this application- capturing the flow of data in the system-as-designed, and the system-as-built. It is also the highest-level view of this solution- showing interactions between the microcontroller transmitting it’s health infromation (from inside an ambulance) to the website presenting that transmitted data as visuals on a analytics dashboard. Each phase of the solution is labelled (from 1 to 7), and a brief description is provided for each section.
System States Diagram
![]()
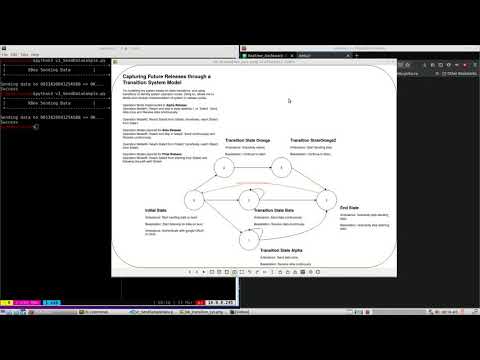
Figure2 shows the Alpha, Beta and (other) Omega releases in the form of a state diagram. This figure absracts away individual hardware and software components, considering them as a whole i.e. a system. A breif description about the state diagram, and each release is provided in the figure. For more information please refer to corresponding release(s) in the Technical Video Demonstration section.
Solution Sequence Diagram
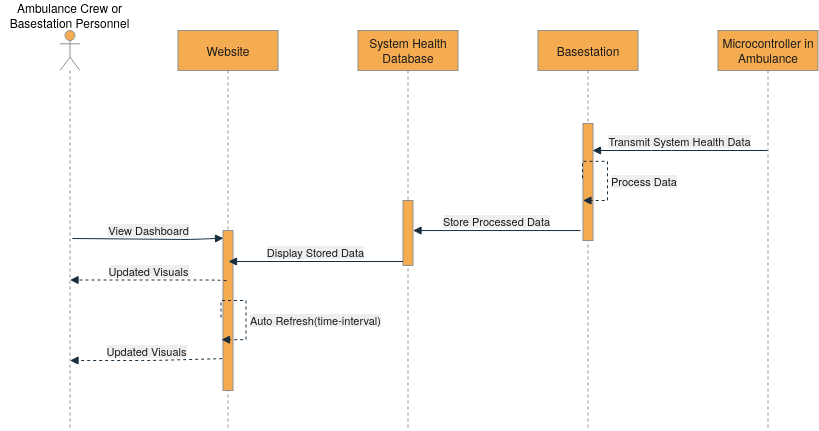
Figure3 presents a lower-level view of this solution, compared to the architecture diagram. This figure considers the target user(s), and identifies their interaction with each component of the solution. In it, a Ambulance Crew or Basestation personnel memebers wants to view the dashboard. To do so they access the website, which is in production, and is updating the presentated analytics visuals; real-time as more microcontroller health data is transmitted (from the microcontroller in the ambulance, connected to an XBee transiever) and recieved on the Basestation.
System-As-Built Hardware
This section details the hardware and software configuration of the hardware components used in this project– a Raspberry Pi 3 B+ and Dell Optiplex 7010 desktop are used as a the “ambulance” and “basestation”, respectively. The key configuration for data transmission is mode of the XBee transiver, to which the Pi or PC is connected too.
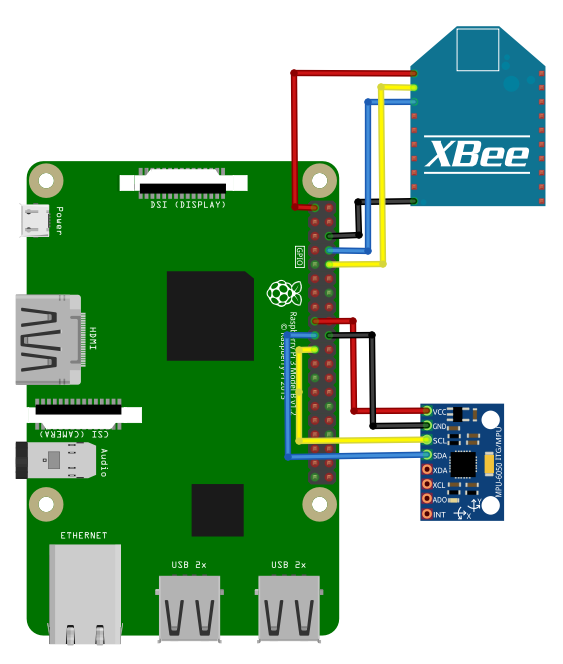
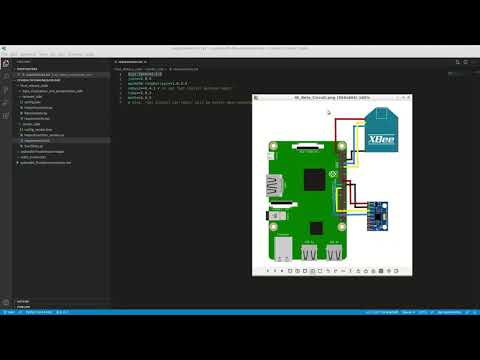
Raspberry Pi 3 B+– transmits health data
Figure4 shows the fritzing diagram of microcontroller used in the the system-as-built, in this final release. It shows the Raspberry Pi B+ used, along with the XBee transiever and Gyroscopic sensor connected to it.
Configuration(s):
Operating System: Raspberry Pi OS 32-bit (Released: 2021-01-11, 1.1GB)
Manufacturer and Model: CanaKit, Raspberry Pi 3 Model B+
Processor: Broadcom BCM2837B0, Cortex-A53 (ARMv8) 64-bit SoC @ 1.4GHz
Python version: Python 3.6.9
Memory: 1GB LPDDR2 SDRAM
XBee Model: XBee Pro 538
XBee Mode: Router
XBee Transport Mode: API 2
XBee Connection Port: /dev/ttyS0
XBee Baud Rate: 9600
XBee MAC address: 0013A2004125A5B9
Gryoscope Sensor: MPU-6050
Gryoscope Sensor Version: SEN-11028
Note: XCTU was not installed on the Pi. This was because of software architecture constraints where XCTU executable code cannot run on a ARM based processor.
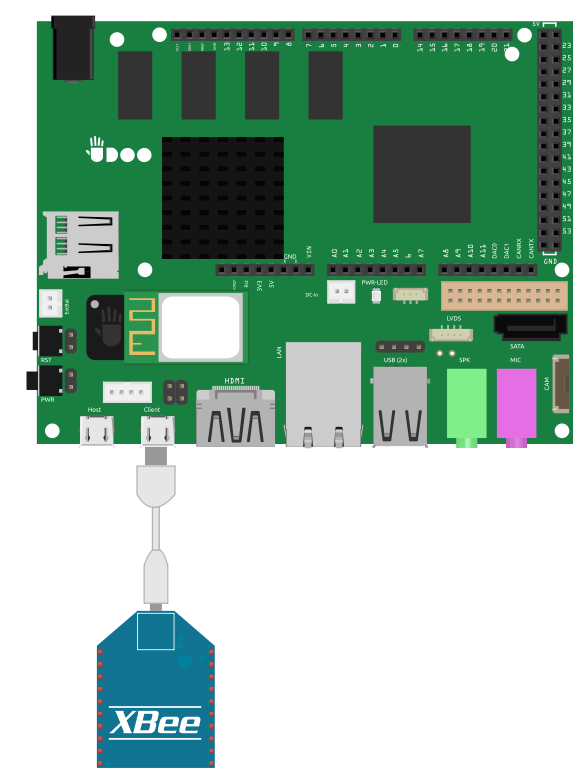
Basestation PC– recieves health data
Figure5 shows the fritzing diagram of Basestation PC used in the the system-as-built. It shows the chipset of my Desktop PC connected to the XBee transiever through a USB cord.
Configuration(s):
Operating System: Lubuntu 18.04
Manufacturer and Model: Dell, Optiplex 7010
Processor: 2.3 GHz Dual-Core Intel Core i5
Python version: Python 3.6.9
Memory: 8.0 GB
XBee Model: XBee Pro 538
XBee Mode: Controller
XBee Transport Mode: API 2
XBee Connection Port: /dev/ttyUSB0
XBee Baud Rate: 115200
XBee MAC address: 0013A2004125A5B8
XCTU Version: 6.5.5
System-As-Built Software
This section presents the webapplication dashboard of this project.
Figure6 shows the system health reporting application. Please click on the image to access the login page to the dashboard. To access login credentials, email sid16@my.yorku.ca.
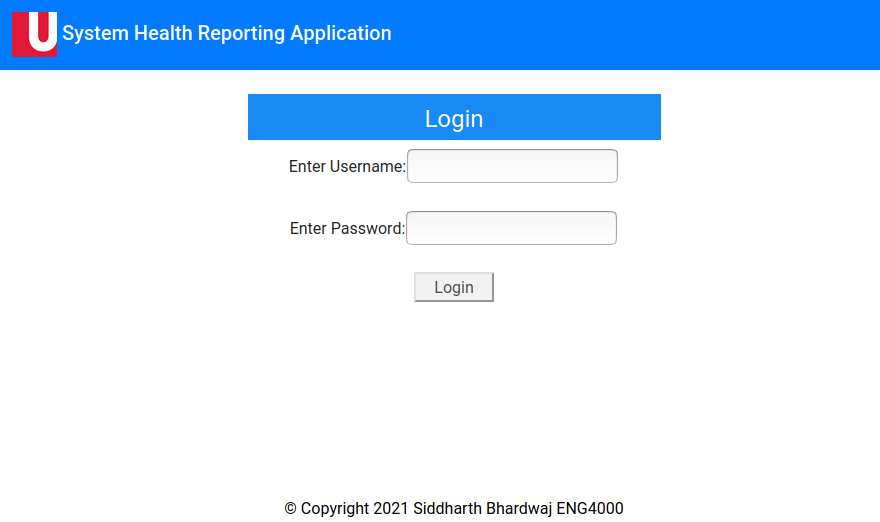
This same application, in Beta release version can be accessed from here.
I cover the written code in-depth in section Deep-dive into Code. However, in short, I have two python executables running- one on the Pi, and the other on the Basestation PC. The Pi sends data about it’s health to the Basestation PC through XBee Zigbee protocol python APIs. I also detail python libraries used and their versions in Tested Software Configurations section.
Technical Demonstration Videos
This section shows the technical demonstration of each planned release of this project.
NOTE: Please watch this video before watching any technical demonstration videos below.
Alpha Release
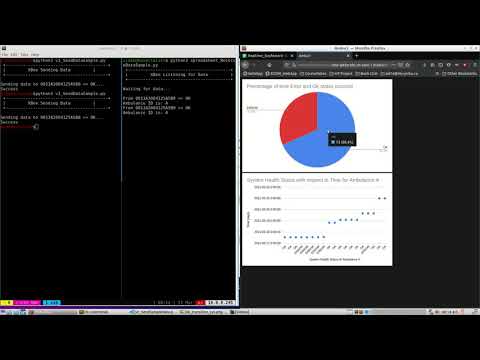
Shows Figure7 (below) that demonstrates the end-to-end solution in it’s alpha release state. This video was recorded on March 22nd.
Video Transcript
Alpha Release Video Transcript
Beta Release
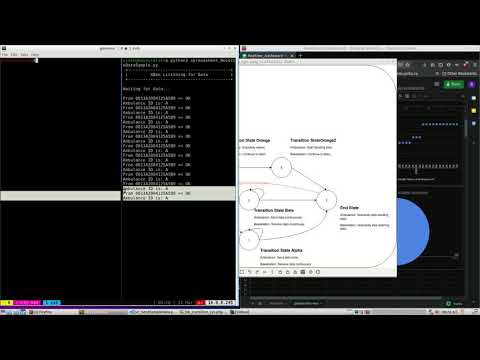
Shows Figure8 (below) that demonstrates the end-to-end solution in it’s Beta release state. This video was recorded on March 22nd.
Video Transcript
Omega Release
Shows Figure9 (below) that demonstrates the end-to-end solution in it’s (other i.e.) Omega release state. This video was recorded on March 22nd.
Video Transcript
Omega Release Video Transcript
Data Propogation Reliability Test
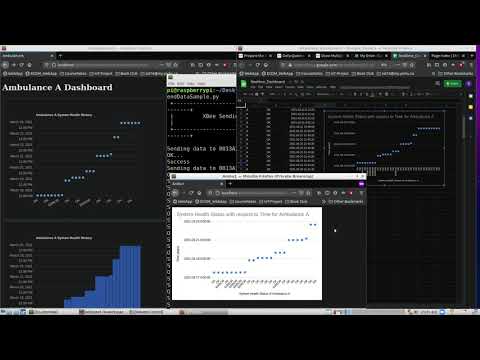
Shows Figure10 (below) that demonstrates a test performed to improve data propogation reliability on the web-based anaytics dashboard. The application was in Beta Release during this demonstration. This video was recorded on March 29th.
Video Transcript
Data Reliability Test Video Transcript
Error Notification Feature
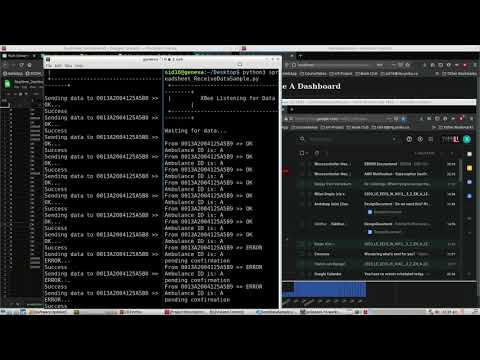
Shows Figure11 (below) that demonstrates a push-notification feature implemented to improve user convinience. The application was in Beta Release during this demonstration. This video was recorded on March 29th.
Video Transcript
Error Notification Feature Video Transcript
Final Release
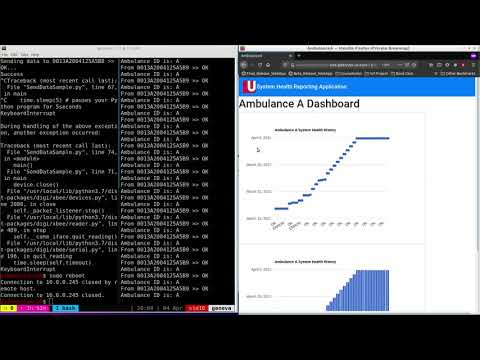
Shows Figure12 (below) that demonstrates the final release of this application. This video was recorded on April 4th. Note: key moments of this demonstration video have organized into “chapters” (to improve viewer convinience), if you follow the link below to the video on Youtube.
Video Transcript
Final Release Video Demonstration Transcript
Deep-dive into Code
This section presents a deep-dive into the code written for the project- considering the “sender side” and “reciever side”. Also, it shows the tested software configurations (such as python libraries, etc) used to achieve expected and presented (above in technical demos section) functionality for this solution.
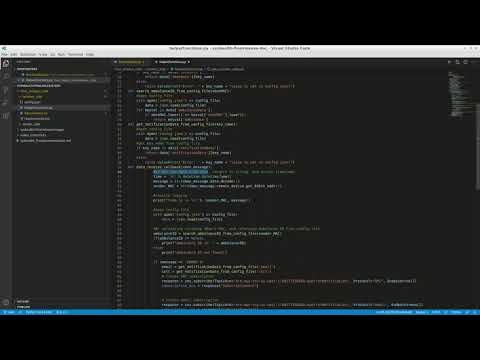
Sender Side
Figure13 is a video in which I deep-dive into ‘Sender Side’ code. Please click on the image to access video.
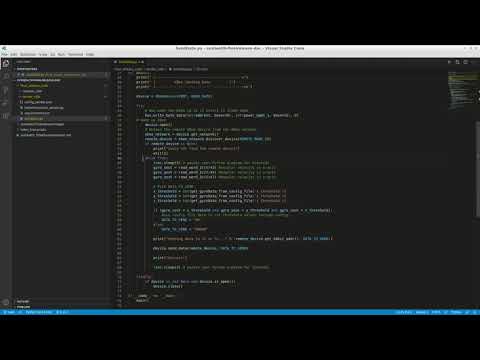
The code shown in above video can be accessed from here.
Reciever Side
Figure14 is a video in which I deep-dive into ‘Sender Side’ code. Please click on the image to access video.
The code shown in above video can be accessed from here.
Data Visualization and Presentation Side
Figure15 is a video in which I deep-dive into ‘Data Visualization and Presentation Side’ code. Please click on the image to access video.
The code shown in above video can be accessed from here.
Tested Software Configurations
Figure16 is a video in which I present the sender side and reciever side software configurations as utilized in my production environment. Please click on the image to access video.
The ‘requirements.txt’ files shown in above video can be accessed from here for Reciever side, and here for Sender side.
Financial and Management Volume
This volume is about the financial and management aspects on this project, examining project progress as planned versus as executed. Furthermore, presents a failure report, and lessons learnt section.
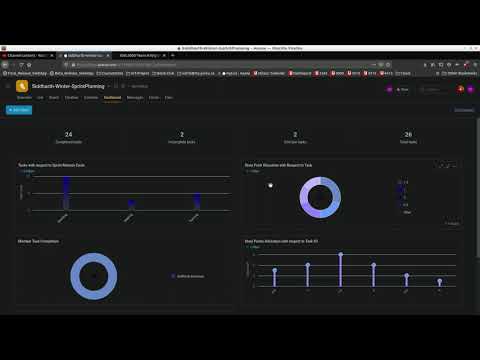
Backlog and Planned set of Deliveries
Figure17 is a video in which I address what did I ended up not doing, doing, and how things went different (if at all).
Estimated Budget for Rebuild
Business Plan
Addresses: Why is this an adequate solution(important financially)? How do you get from this to a full-up system?
The solution implemented for this project has parts which can be bought in bulk. Detecting problems early so that there is less downtime, which means ambulance crews can focus on part of the job that cannot be automated. This part of this solution is relatively low cost compared to the pneumatic pumping, which would be expensive to implement redundancy on. This solution is not providing a means to recover in-case of failure, it is providing early warning of failure, and supporting quick recovery from failure.
If this solution is not implemented, it requires paying someone to constantly report on system health. By having an automated system- 1) if bvm fails basetstation cantell crew 2) it allows the basestation to have parts to swap out when ambulance comes back 3) another ambulance that is off duty can be triggered to bring in a spare in their ambulance. In essence, this part of the solution has the potential to improve patient mortality- quicker detection of failure and quicker recovery from failure. Also, it’s less expensive than a fully-redundant pneumatic pumping system.
A full up system is a robust, fully functional and reliable system. In essence, a full-up system is a (possibly proprietary) final product.
The features needed to make this implemented solution a full-up system are:
- Reporting on intermediate ambulances.
- Configuring other sensors through config file.
- Making the web-interface more intuitive and configurable by the end-user.
- Making the visuals more informative.
- Mechanical interface (i.e. wiring and how it gets mounted to ambulance) improvement.
Failures and Lessons Learnt
Addresses: How did plans deviate (if any)? What to do the same or different for project, team and yourself?
Plans deviated from original when I was not able to obtain multiple Raspberry Pi units. This was due to the 1000$ financial budget allocated to teams, and also because of the Pandemic- the deliveries of these parts would not be in-time for the planned final release. Instead, I focused on building other parts of the project that drove the product further. In essence, I pivoted from adding multiple Pis to adding a push-notification error feature, which did not have any task dependencies and was built using Software. Otherwise, all tasks were executed as planned (though here I’d like to acknowledge again that the work done could definitely be better e.g. make the analytics visuals more meaningful, test transceiver communication with a 9km radius, etc).
For the project, I would do everything the same (as done for this winter-term project). I am satisfied with work inputted, and corresponding output achieved- in a course of 3 months I was able deliver an end-to-end solution.
For the team, I would want to operate better in a team setting. Our team faced alot of challenges in the fall term, which impacted members in their personal lives- speaking for myself. Thus, I would want to want to work differently (i.e. better) in a team setting with other members to deliver a meaningful solution as one unit.
For myself, I’d like to have a different mindset when initially starting ENG4000. I enrolled with a mindset that by joining a team and working on a project, I would be able to find meaning that would help me grow as an engineer. However, if given the opportunity, I would change this mindset to- instead of waiting for that meaning to come to you within a project, you have to go search for that meaning within the project itself. It’s not going to appear “one-fine-day” rather you have to diligently look for work within the project that would add meaning to you as an engineer or builder. In essence, this is the mindset I would’ve liked to have had when enrolling this course, and deciding on team-members to work with.
Also, some key areas where I observed personal growth were:
- Bias for Action: diligent conducting sprints, completing tasks, and using time with my supervisor for feedback rather than direction. Throughout the semester, I made sure to do the work ahead of time or build an example before taking it to my supervisor for feedback. In essence, I boosted project progress by having conversations with my supervisor at level 2 instead of level 1 through my bias for action.
- Dive-Deep: taking on an unknown topic by dedicating time to reading documentation, testing and integration into the project. I have zero prior experience with Google APIs. Thus, in deciding on the technology to use for data storage I collected data from supervisors and peers, then dove-deep into understanding what are Google APIs and how can I use them in this project. Through a successful deep-dive I was able to learn about and understand Google APIs and then subsequently use them in two parts of this project- data storage and data visualization.
- Ownership: through empathizing and understanding the problem I was able to take ownership of this end-to-end solution- delivering a working (but still could be improved) product. In essence, through this ownership I was able channel my passion and motivation to successfully deliver an alpha, beta and final release; of this solution.
- Learn and be Curious: through viewing unknown knowledge from a lens of curiosity, and channelling that into a desire to learn- I was able to drive product development by diving-deep into learning about technologies (using XBee transceivers to create a mesh network, Raspberry Pi, Google APIs, etc), and techniques (using java-script to generate visuals, using configuration files, etc).
- Earn Trust: through the work done in the Alpha, Beta and Final release I was able to earn trust with my supervisor and stakeholder.
- Deliver Results: through the final release of this end-to-end solution I was able to deliver a meaningful solution that could help ambulance crews and basestation personnel– potentially improve mortality rate through using this fault detection system. In essence, I delivered on all committed-to tasks that constitute to the delivery of this final project (system health reporting application) in ENG4000.
References
- Deliverables Documentation.ENG4000 Fall-Winter-2020-21. Retrieved from: https://eclass.yorku.ca/eclass/course/view.php?id=6123